

Analytics is part of Starter and above.
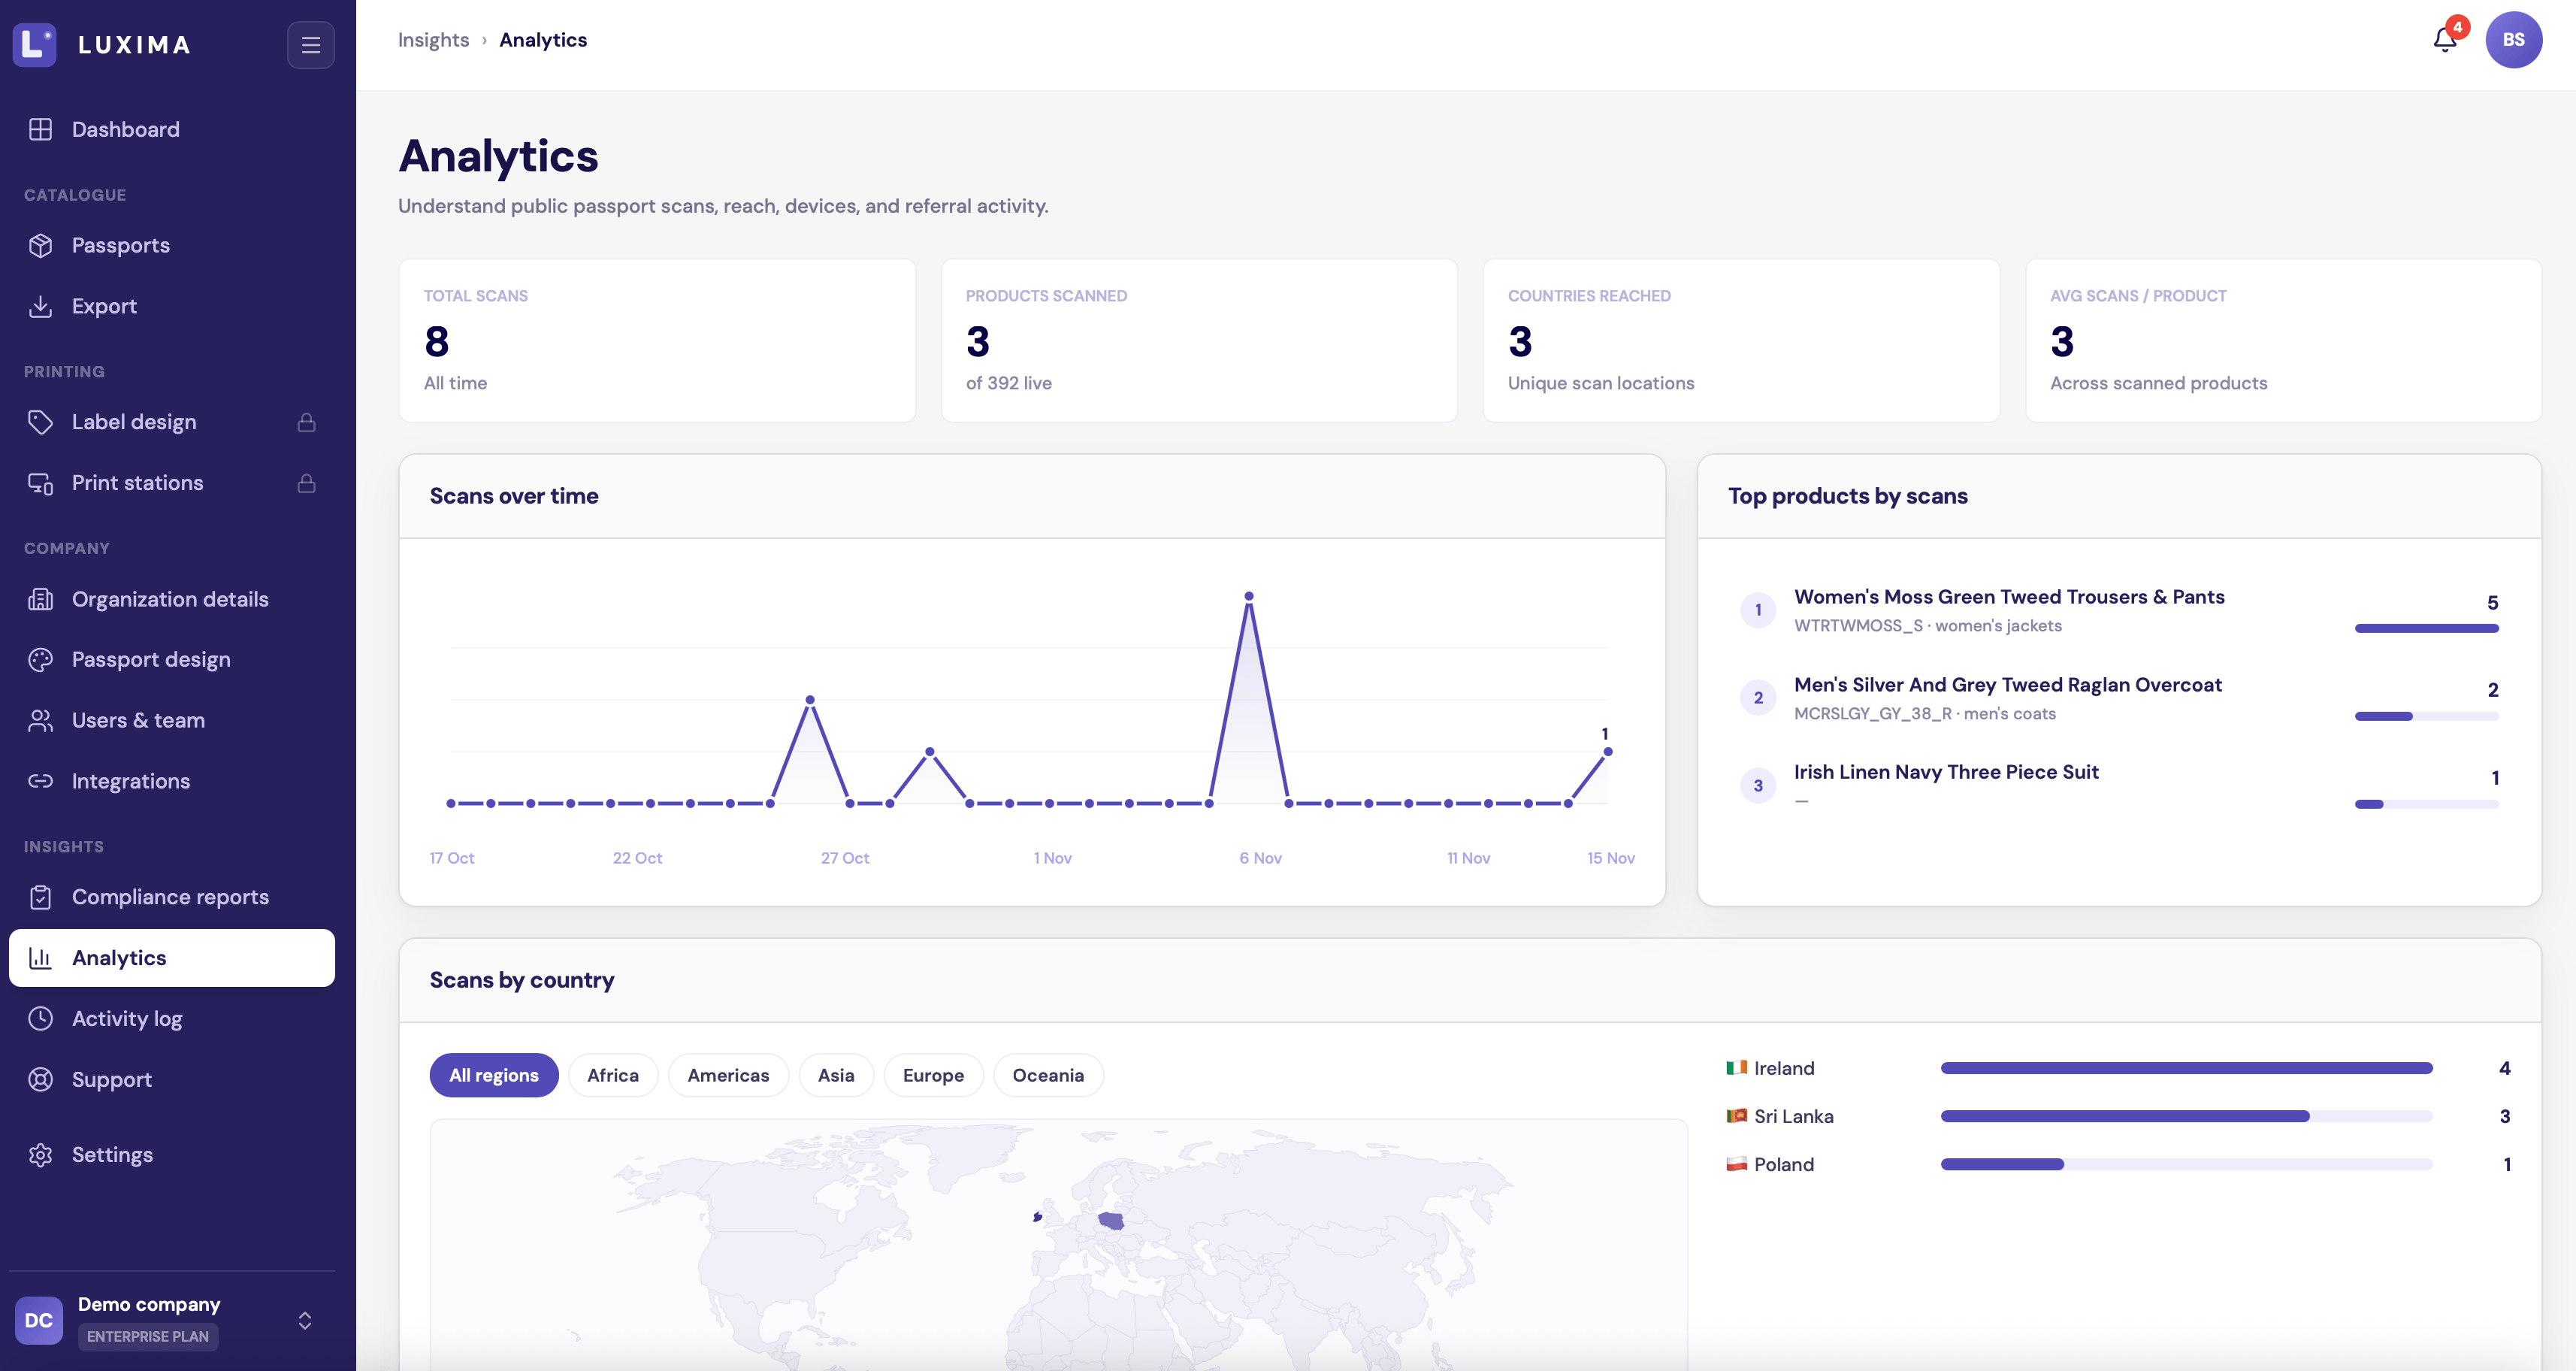
Analytics: the totals, scans over time and your most scanned products
What counts as a scan
A scan is counted each time someone opens a public passport, whether they scanned the QR code or followed a link. Opening the same passport again counts again. The figures cover the last 30 days.The numbers at the top
The charts
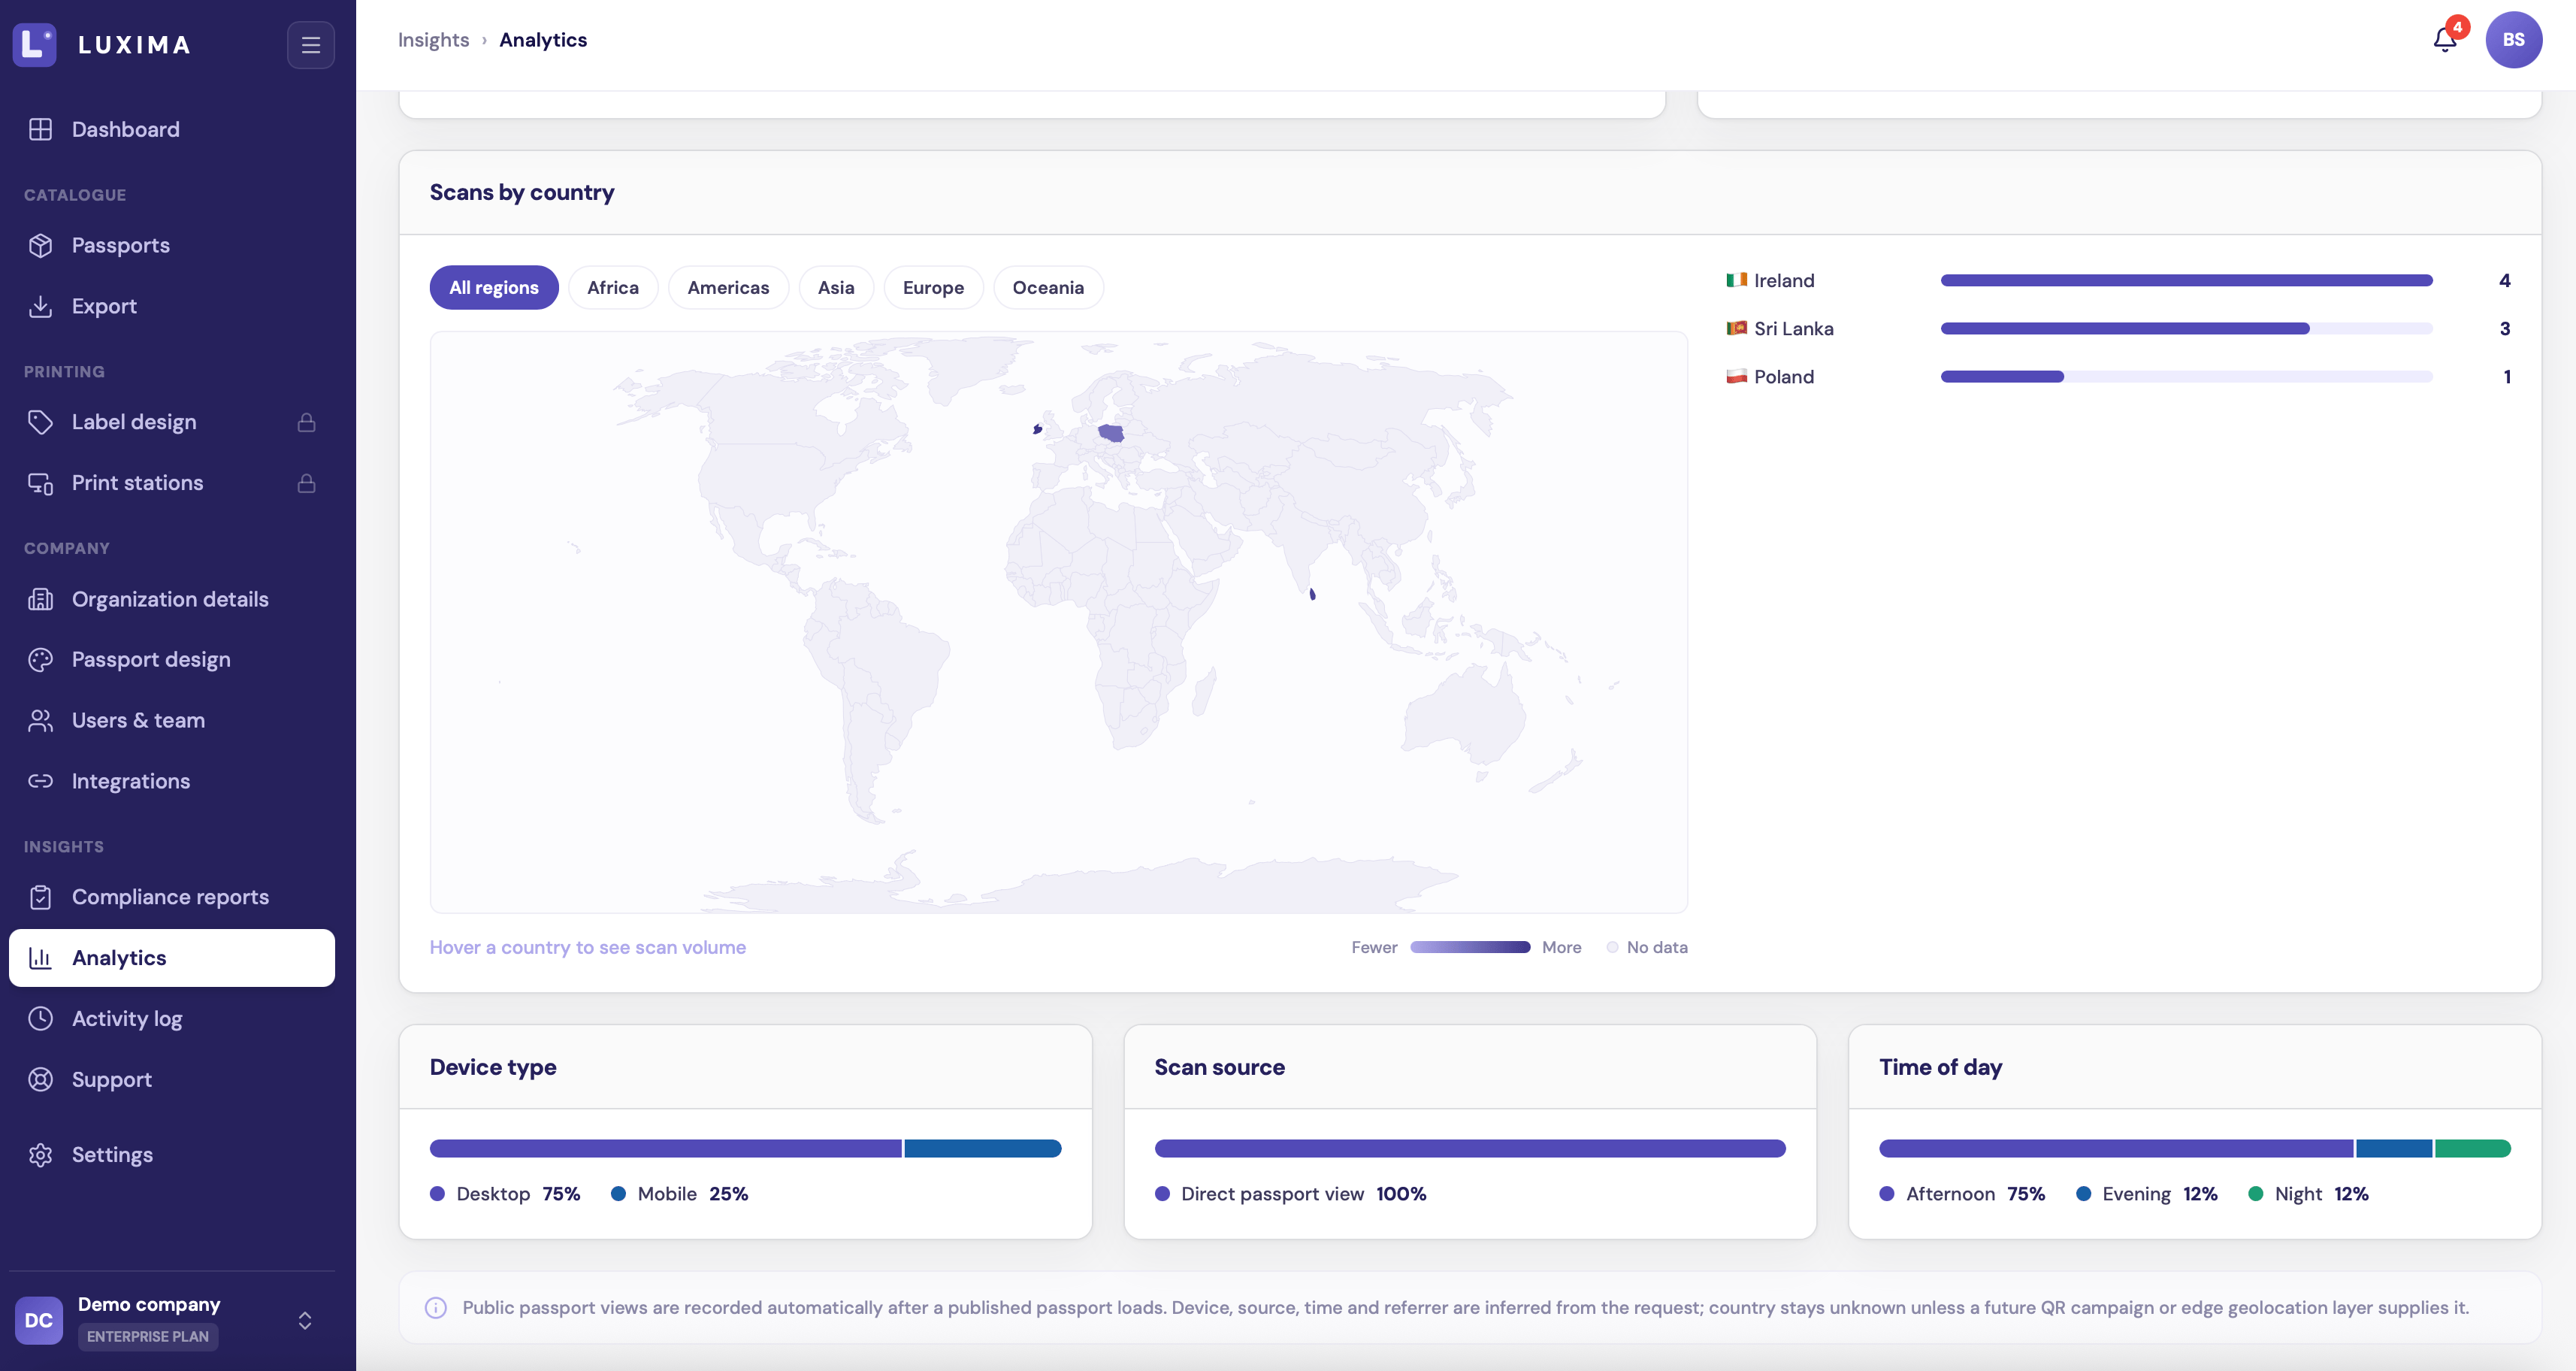
Scans by country, device type, scan source and time of day
Scan source
- Direct passport view: the passport was opened directly. Scanning a QR code counts here.
- Referral link: the person followed a link from another website.
Before you have any scans
Until your first scan, the page shows example charts marked Demo data, so you can see what it will look like. They switch to your own numbers automatically once scans start.What LUXIMA records
For each scan LUXIMA records the product and variant, the time, the country, the type of device, and the website the visitor came from, if any. It does not record who the visitor is.Getting more from it
- No scans yet? Check your passports are published and that the QR codes are on your products or labels.
- A product with many scans is one customers are curious about. Make sure its passport is complete.
- Many scans from one country shows where your products are getting attention.